← All resources

Reach Australia Podcast Understanding Community

26 June 2019

As part of the Reach Australia conference, Geoff Brailey from McCrindle Research runs a workshop into how to use statistics to get a better grip on the community you are…


Transcript

This transcript has been generated, and can contain errors. Please refer to the original recording for the definitive language used.

Read transcript

[0:00]
All right, we'll kick off. Well, good afternoon, everyone. If we haven't met, my name's Arcos. I work for TGCA, Gospel Coalition Australia, but I'm on the Reach Australia Committee, and I'll be emceeing this afternoon's session, which is all about understanding your community. Now, I'm sure you're all aware Australia is changing demographically. There are massive changes happening in terms of age, in terms of the minorities that make up Australia, in terms of worldview. you. And here at Reach Australia, we are a movement that's all about trying to reach Australia with

[0:30]
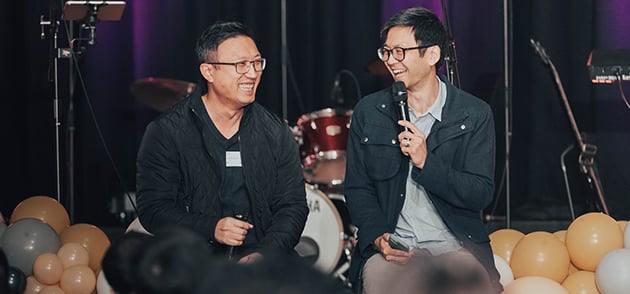
the gospel. And as we heard this morning, one of the ways we want to do that is by firstly understanding the people that we're trying to reach. Now to help us with this important task, we have Jeff Bailey, a researcher from McKindle Research, who's going to present to us. And I might get Jeff to come on up. I'll quickly interview him before he gives us some research. So, yeah, give him a hand. Thank you. Great to be with you. Now, Geoff, you work for MacRindle. For those of us that don't know who MacRindle is,

[1:02]
do you just want to give us a quick update on who MacRindle Research is? Yeah, thanks. Yeah, MacRindle's a research company. We really love bringing data to life. So hopefully you've got one of the infographics. We've brought a couple along with us today. So there's the population map. It's about a uni course all onto one page there in terms of just a quick summary as well as one about the emerging generations. I love studying the social trends. So it's a real interesting company. I came from having a phone call today with someone from Food Bank looking at how can we really resolve food inequality in Australia? So how do we use research to inform that strategy for a great organisation?

[1:34]
So it's a fascinating space to be playing and working in. It is a lot of fun, but we do get our hands dirty doing the research and analytics and getting to come along to great events like this to present. So real pleasure to be here. Awesome. It's great to have you here. So understanding your community, you're going to give us a bit of demographic analysis. What are some key takeaways? Like if you want to maybe steal a bit of your thunder, give us an overview, a snapshot of what are some things you want us to walk away with. Yeah, from today, I really want to give you guys the tips and even the skills to be able to see. I'll present some of the national trends, how we're ageing,

[2:07]
we're culturally more diverse now than ever, we're growing, some of the forecast, but then also to give you the skills to be able to look into your area because not every area is the same. The communities are different and this is where we're really here understand your community from the data to help sort of drive some mission strategies. So pretty exciting to see a room full of people who don't mind the stats and we'll keep it a little bit light-hearted as well so it won't be too dry. Important to remember that Rudy Hill is not Randwick. All right, how about we pray and then I'll hand it over to you, Jeff. All right, let's

[2:38]
pray. Heavenly Father, we thank you that you've entrusted us with the gospel of taking the gospel to the nations and in particular to the people around us and around our churches. Please give Jeff wisdom to show us what we need to know to better further that mission and give us ears to hear, to understand and to implement what Jeff tells us so that we can better reach people with the glorious gospel of the Lord Jesus Christ, in whose name we pray. Amen. Thanks, Arcos. It was fantastic to be here. I am from Sydney and really delighted to come here.

[3:09]
My wife and we've got two kids, a third on the way. Been living in the northwest of Sydney in a suburb called Rouse Hill where I'm actually part of a church plant that's been going for three and a half years and working in the youth and discipleship side of things. So I had people around last night eating chocolate cake, talking about how do we actually grow these new Christians and what would be helpful next steps for them to take. So I do sit in the same seat as you and at the same time I'm really fortunate to have spent the last four years working at MacRindle, a social research company. So I work and my title is lead solution designer. So I'm often good at creating

[3:45]
or out and about, but when I'm at work, I'm helping to solve problems using research to kind of drive change and help people be effective in their work and communities. So today we're going to look at your community, but particularly we'll start big picture. In terms of what I do, I kind of introduce myself at parties saying I'm a social researcher, which doesn't really give a lot away, so I kind of maybe use this slide to help explain what I do and a bit about me. If you can appreciate Steve Carell. it's just a great photo I love slipping that one in so we're going to jump into a bit of

[4:16]
bit of data today but for us at MacRindle Mark MacRindle the research principal has done a TED talk on bringing data to life which is really where these infographics in your hand hopefully help speed up the understanding process and equip you to make better decisions as well so in terms of where we're heading today we're going to look at the scriptures to begin with because in John 4 this great passage where Jesus is at the well with a woman, chatting about water, but then his disciples come back and he switches it because he's talking to a guy and he starts talking about food. He knows men very well. And Jesus tells them, I've got food to do that you don't know about. But

[4:51]
he's really trying to help them see that there is a harvest in front of them. He's saying to them, open up your eyes, look at the fields. And he's trying to help them see that for these 12 men, the mission field is right in front of them. It was a woman from a different culture, it might have been a bit of a shock to them, but this was the mission field that Jesus was helping his disciples to see. It took them three years to get there, hopefully we can learn maybe even faster, but I've taken 10 years at Bible College and still on that, I've finished, I've graduated,

[5:22]
but boy I don't feel like I've got it all figured out. 10 years and I feel like probably people in the room are smarter than I, but from what I've learned at MacRindle, really excited to share that as a social research company, we're trying to help organisations, whether it's churches, trying to understand their communities, and sometimes there's some research costs to that, which we know can be a little bit inhibitive. So we're creating something called City in Field, which is this new sort of sub-brand of McRindle to really help people understand their mission field. And often that might mean a city. We're aware of that urbanisation trend,

[5:53]
but we're not saying that it's exclusively going to work for people in metro areas. This little tool that we've developed called the Five L's, it's a Know Your Community video training series pulling together some great content that we can scale and distribute through online methods, trying to use the technology and all the trends that we study to help empower people to lead and know their community. Now this 5Ls is really a framework and I've been having the privilege of sitting with church planters, having coffees and having the conversations about what does it look

[6:23]
like to plan to reach an area, whether it's an area like I've been chatting with a guy who's doing something here at Wentworthville in Sydney, sort of west, we nearly called it inner west, it's probably the inner west of Parramatta, if you know Parramatta. It's in that vicinity. But what does the area of Wentworthville look like? And how's that different to Parramatta CBD proper? Or it's really, I guess, a way of understanding your community. And there's five L's, as you might expect in this, and those little icons might even start giving it away. But the first one is to look into the area. And these are what I'll talk through today, is how do we look into an area

[6:56]
to see the people? Like the disciples, I've probably been a bit blind to the people in my community in Rouse Hill, but by sitting at that local playground at the Rouse Hill Town Centre on a Saturday morning, having a coffee, watching my kids, two kids, watching them run around that playground, seeing who actually is sitting next to me, what nationality, what age, as I walk those streets, who am I encountering? So it's a way of visually, and more than just your personal experience, we're using the data to understand those demographics. So giving you a few of the insights into how to do some demographics today, so I hope you're prepared for that.

[7:28]
had a coffee we don't want to do statistics without coffee so be ready to roll with that the second l is really around how do we listen to our community because looking at spreadsheets is helpful having conversations though is really where things can really ramp up and that might be conversations on mass maybe through a survey or running focus groups or doing expert kind of interviews one-on-one phone calls to understand the people who live in your area so we kind of in this video training series have a whole lot of equipping around how to do some research yourself

[7:59]
so that you can know your community. Because each community is different. You'll hear me talk that through today. The third one is about learning. And thankfully, we're often not the first people to start learning about our community. There might be other reports or research papers about your area. Maybe it's the local council. Maybe there's another organisation that's really diving into that sort of geographic region. So sort of taking that humble position and saying, who could I learn from? Who is actually already starting to get to know this community a part of. So sort of taking the piggyback approach and saying, what can I build on that

[8:33]
someone else might have started doing? The learn is really, I guess, leading us to understand that we need to love the people in our area. And this is to say there might be needs and fears and hopes for this community that we can support and address and maybe even resolve. But even to just be present is so important in our communities and to be real with the people that we are doing life with. But we do want to share the gospel and reach people, as I love the theme of this conference, the task before us is to lead people to Christ and to lead our community so that the kingdom will be made

[9:04]
real here on earth. We do want to see that gospel transformation, that kingdom demonstration and leading people to Christ is where we want to see strategies developed. What would it mean to reach the people of, for example, the suburb I live in, the suburb you live in? Maybe it's more than just a suburb, maybe it's a region, a city, that mission field in front of us. So today we're going to jump into that but I do want to zoom out in a moment and share some bigger trends but the reason I guess I'm here today is because four years ago before I started working at MacRindle this was

[9:35]
probably my attitude to jumping into demographics. I probably felt a little bit like this and I don't know if you connect with that image and feel that same pain of thinking, what a talk on ABS and consensus and what am I doing here? This isn't, I can't move in this space. We're really trying to equip you today and these five L's to simplify. It's the first three around understanding the people and then the last two around how do we prioritize some really effective strategies to have that mission impact of loving people and importantly leading them to Christ. And we've

[10:06]
got this video training tool that has an Excel spreadsheet in there, I've got to admit, because we can't help but put some good data into it and then help you prioritize and rank and assess what are those responses to the trends that you and your team come up with so that you can kind of be strategic and go this is one we need to prepare for in the future we can see a trend on the rise we might not be ready to respond we don't have the resources or training today but we can see that in two five years we're going to need to prepare for responding to this trend so let's

[10:36]
start putting those early steps in now. So the tool is really, I guess, a way to say there's some videos that will get you practically working with your team, as well as scientifically drawing on some data to inform some change. And to find out more, I'm just going to show it straight away, because hopefully you're interested, and you can pop your details on this website, cityinfield.com.au, and you can just, if you pop your details in, we'll just let you know when that tool becomes at the moment. It's pretty exciting, but I'm looking forward to getting it done. I don't know

[11:08]
if you've been in that video production stage. It takes a little bit longer sometimes than you might anticipate, but it's exciting to see that progressing. And we do want to start today looking big picture. What are those national trends and thinking about the church and the culture that we live in? And I'll also share what are some of the latest insights we've seen from our national surveys, from running focus groups with Australians to understand what do people think about Christianity? What do they say about Jesus? So I'll share a few of those insights in this session as well. How does that sound?

[11:39]
You in the right room? If you need to, no, I'm joking. Please stay, please stay. We're going to have some discussions as well. Maybe just to, I guess, prime the room. Is there any questions at this point or anything you'd really love to know when it comes to demographics or understanding your community? Just so that we're really clear on where to head. I've got a whole lot of things I've prepared to share, but I just want to make sure it suits you. Is there something you'd like to get out of today that I can really make sure I hit on today in terms of the content that I've got lined up or can introduce? Any expectations? Thank you, sir.

[12:10]
Yes, I love demographics. I've used them and enjoyed that. The city link that you're going to be doing, that's going to be at a cost? That's going to be… Yeah, it'll be a small, under $100 we're thinking, so… Yeah. Any chance you can put that previous slide back up so I can take a picture of it so I know where I'm going? Thanks. Yep, City Infield is the one to head to. Sorry if I moved too fast. Just over here as well, thanks. I've got one.

[12:42]
Yep, mic's coming, I think. We'll make sure everyone can hear it, me included. Thanks. Can you give an example of a church that has gone sort of deep on the sort of demographic information you're talking about and has made a particular focus change and how that's impacted them? Yeah, that's a good question. It's early stages for us in terms of these conversations. As I say, it's been probably about the last 12 months we've been developing this tool. So I've seen church planners start using it.

[13:12]
I know Scott Sanders has started using this tool, this framework with people as well to just really emphasise who is actually in your community. Looking at an area, a different example, but there's a school that we know that have kind of invested heavily into a campus location. They thought there was really great growth in the young population, good for a school. But when we actually ran the numbers for them after they'd purchased it, it wasn't a good area. So it's really kind of informing, even before you head into that location, just doing some of that preliminary work to make sure,

[13:44]
yeah, is there the cultural group that I'm best suited to and know that there's not just one culture often in an area. early days in some of this research but just great in terms of a personal experience I had was we ran Alpha with some new Christians at our church and I wish I'd known who was the top five cultures in our area because the first lady who showed up was from a Filipino culture and just to have even been able to open the door and if I'd known those top five cultures and known how to say g'day in Filipino that would have been really great just to personalize that experience and

[14:15]
it's not impersonal to do your homework I think it shows a bit of effort and diligence and example I would have loved to have known so that when someone walks through the door, whether it's the church doors or your home for a group like Alpha or something like that, to be able to really bring that personal touch to people. I think that'd be great. Maybe just one more question, then we'll jump in. Just see you next year. Thanks, Arcos. I was just wondering, is your research specifically Australian? And if so, do you know of other groups, say for New Zealand or I'm from

[14:45]
New Zealand obviously but brilliant yeah we we have done the faith and belief study for Australia we did have a brother from New Zealand say let's actually get this done in New Zealand so on the MacRindle blog you can find the faith and belief New Zealand study that we just did and launched last year so there's a whole report a whole infographic just on the New Zealand response to faith and spirituality so the MacRindle blog is the spot to head to I'll give you my card afterwards if you want to grab that it's been fascinating to see the comparison between the

[15:15]
over time as well be interesting hopefully you're making a big change in New Zealand so we'll be praying for you very cool all right let's see if we can jump in to where we're up to I might have let that sit for a little bit too long sorry gents in the AV room if we can reconnect that'd be wonderful I think I've lost the screen there so let's we're going to jump into some of the national trends talking about change how things are moving and shifting it'll come back up shortly but all to say we're going to really dive into what are those big picture trends, maybe just while you've

[15:47]
got in front of you, I can see a few people doing it while I'm speaking, which is okay. That infographic Australia's population map, the blue one, is the one I want you to have in front of you as we jump into this next section. We're going to talk through some of the demographic trends. You'll see on the front cover, on the top right hand side, we've got the top 30 cities and towns by population size. You'll see Sydney at the top at the moment. Melbourne is growing faster at that recent demographic data. I'm sure you all were aware it came out last week on Wednesday,

[16:18]
so that was exciting to see. Melbourne is growing faster. Victoria growing faster than New South Wales. The growth of those two cities is really leading Australia's population. Melbourne grew by over 120,000 people last year and Sydney grew by just over 100,000 people. And I don't know if you were at the Sydney 2000 Olympic Games at that Olympic Park in that large stadium, that whole stadium back when it had the extra two wings on it, had the capacity of 100,000 people. And that's what Sydney is getting added to it every year at the moment,

[16:49]
which probably explains some of the stress of people in traffic and house prices. Maybe it's one of those key factors informing that growth. Let's see if we're ready to roll. We're just still working on those slides. But what we'll do is, in terms of the demographics, while you've got that slide, that infographic in front of you, just on the reverse of it, you'll see that there's six generations at the moment in Australia's population. So what we've got in our population, starting with the oldest respected builders who literally built this nation, could even build their own homes. I'm part of Gen Y and there's no way I

[17:23]
would want to live in a house that I've built. It's not something I would trust, but to this generation I would trust their handiwork. Some very resourceful people who had children in that post-war period who were known as the baby boomers, the boomer generation. They are more than five million in number, baby boomers, who are entering those sort of retirement or even rehirement years, as some are finding. They're heading back into new works, sort of scenarios, or even, interestingly, a lot of volunteering is fascinating to see. A great, equipped, resourced, knowledgeable,

[17:57]
experienced generation helping in a lot of not-for-profits in a volunteering capacity. I'm sure they'd love to be getting paid as well, but I love the heart of the baby boomers. Now, the baby boomers, followed by Gen X, probably a few Gen X's in the room if I'm looking around, but also have followed by Gen Y, who've grown up maybe sometimes getting called as the millennial generation. The millennial sort of sits across the Gen Y's and the Gen Z's, and the Gen Z's are those born before 2010, so 2010 is a fascinating year because that was the year the iPad

[18:29]
was released. So those Gen Alphas, I've got two of that age group, they've grown up with an iPad at their fingertips. And just a practical example, I grew up being always told, keep your hands off the glass, Jeff. Stop touching that, you'll leave a fingerprint. Whereas these are a digital glass swiping generation. It's quite different, the language. They're a bit more of a lean-in generation, whereas I leant back on a couch, the recliner. That was how I relaxed when I was growing up. Fantastic. Thanks, guys. You're keeping up very

[18:59]
along smoothly now. In terms of Australia, we do have more than just the six generations. I'll jump back. Thanks, guys. That's fantastic. The six generations, it's a great way of defining it, but even the life stages, when you look back traditionally, you probably see that there was the historical three. You could even probably say kids and adults was probably even earlier. I think we're pretty accepted of those teenagers since the 60s, 70s, when this adolescent development was being explored in research. But nowadays, we probably see there's

[19:31]
a few new groups, stages of life that we've seen. And this is where we've got the tweens coming in before the teenage years, the tweens. And we've also got those young adults, often called kippers. Now, if you're not familiar with kippers, that stands for Kids in Parents' Pockets, Eroding Retirement Savings. So you might be a kipper or you might know a kipper. I'm a former Kipper, I have to admit, but I've moved out loving life out of a home. But the Kippers, maybe some of the housing affordability played a part, but also increasing educational expectations.

[20:02]
One of the interesting stats at the moment is that Gen X's, it was one in four that went on to get tertiary qualification. For Gen Y, it was one in three. For Gen Z's, it's now one in two. So then to stand out, once you've done that sort of undergrad degree, what else do you need to do to get seen in that crowd? as we have Gen Alpha coming through at the moment. There's 314,000 new babies in the last 12 months alone. So how will an emerging generation in future years, in a couple of decades, when they're entering the workforce,

[20:33]
how will they stand out? What qualifications? It'll be fascinating. Is it still that sandstone institution that provides that entrance into the workforce? Or are things shifting? Are we watching that space? We do have more than just the young adults and the kippers. We've also got those career changes and those down ages. upgrading life stage as they might become empty nesters entering those retirement years. We do, I just want to pause before I keep going, on that infographic as well you'll see that Sydney and Melbourne are growing, they're the two largest cities. Australia at the moment is at 25.3

[21:07]
million, you can probably see it might say 25 million on that one, I even had to check before I came on stage just to check, we're actually about to clock over into 25.4 million, so Australia's growing by nearly 400,000 people a year, which is the size of Canberra every year. Now that growth is coming from a natural increase, so more births than deaths, 314,000 births, but we are also growing through net overseas migration and that actually is our largest source of growth.

[21:41]
Former Prime Minister said it's bringing the best and the brightest and that's for the skilled visas. We do also have people coming on those family visas as well as a few coming on humanitarian visas which is quite a small proportion. I'll leave that for comment for others at another time. The demographics we're really drawing on census data from the ABS. So the census is something that happens every five years. Happened in 2016 and there was a hashtag maybe you heard of the

[22:12]
census fail and unfortunately it got a lot of publicity and naturally when you couldn't log on that night I was one trying to log on and couldn't get through that night the next day we we still did and not we but the ABS did get great data so we can rely on the census and we are very fortunate to have great data collected every five years the growth of our population though over those those last few census periods it is really shifting towards the kind of metropolis areas

[22:42]
Queensland is growing fast as well. Queensland's an interesting state. I'm not sure. Do we have any Queenslanders here at the moment? Good. Now you can talk about state of origin later with these people, but sorry to pull you out like that. But the Queenslanders are actually in an area that's quite geographically distributed nicely. We're not as urbanised probably in Queensland where we've got a spread of cities. If you look through that top 30 list and tick off all your Queensland towns, I hope you know all top 30 and what state they're in. a bit of a geography test. I'm not here to mark it, but it's interesting to see Queensland has

[23:16]
a little bit more of a regional distribution, whereas cities and states like New South Wales and Melbourne are very cap city oriented, which puts pressure on housing, transport, commute times. So there's the agglomeration benefits, the we're better together benefits, is the summary of agglomeration when you live in a city like Sydney or Melbourne, but you also do get those costs, those negative factors that come with living in some of those kind of destination locations.

[23:46]
I think it'll be fascinating, and I don't know about you, but I'm from Sydney and my weekends often revolve around chatting around house prices and who's actually serious about moving out of Sydney's houses. It's a fascinating era with the housing market, but even with the dip, still probably some pretty challenging times and how that's impacting the way we live. But let's keep jumping on because we've talked some population We've talked some generational stats. Let's talk about some of the cultural change we're seeing. At the moment in Australia, 29% of Australians are actually born overseas.

[24:17]
So three out of 10 Australians born overseas. Think of my neighbour. His wife, two kids, spent five weeks back in India. What does it mean to live in Australia but have all your family in another country? What does community look like? My wife was very generous, offering to help take their daughter to school, walk her up the street, because both parents are working to live in that location. So how do you do childcare? How do you find ways of getting to employment?

[24:49]
It's a fascinating country in terms of the cultural diversity. In terms of where the top five countries are, at the moment it's still UK at the top. So that Anglo heritage is still top of the list. then interesting to see that Asian shift, China, India and the Philippines and so really I guess positioning Australia, if you see that little blue circle now on the screen, there's more people who live inside that blue circle than live outside the blue circle and Australia positioned right on the

[25:23]
doorstep. Pretty strategic location I think for this time, for this era of sharing the gospel, even one of our top three exports as a country is the international students coming to Australia at our universities. So it's a real privilege to do work with some of the organisations in universities helping to share the gospel with some of those students. It's an exciting and fascinating space to see mission occurring. In terms of cultural diversity, this is where I think it really does need to become a local story though

[25:53]
because those top five probably aren't your suburbs top five. So it's really important that you understand the national trends, but then be able to dive into the data. So we'll get to that in a moment. But one of the interesting things in this global and digital era is what are the, I guess, the number of devices that people have. This stat astonishes me that it's forecast by the year 2020, not too long to go, there'll be seven devices for every person on the planet. Now, I don't know if you can do the quick count,

[26:24]
thinking about what you've got in front of you, the smartphone, maybe you've got the iPad and the laptop, app or work, maybe it's a desktop still, but you get there pretty quick if you're then also wearing a Fitbit or some sort of technology or if you've got the streaming or the gaming device at home, you get to that seven pretty quickly and there's probably a few people much higher than that if we're seeing that at a global level. But it's interesting when you come to see, well what are the fears of people in this country in terms of what are Australians actually scared of and

[26:55]
And despite all that migration, you might think it's going to be snakes and sharks and spiders. But we see that the biggest fears of our generation are actually things like, it's low Wi-Fi, this is no good. Also, buffering. And you might be thinking, what could be worse than buffering? Well, it's when it's low battery. That's what's worse. So we do need to keep in mind those digital fears. I don't know about your heart rate, but when you arrive at a place, do you look around to find that nearest PowerPoint? and I know I can plug in and recharge if I need.

[27:27]
Fascinating to see. So how do we see community changing in this global, culturally diverse, intergenerational, national community? Where do people go to find community? We actually thought, well, that's a great question to ask to Australians. So we sent a survey to 1,000 Australians and we asked them, where do you find community? And we thought maybe the church might be at the heart of the community. Often it's on the corner of a village or a town. We wondered, is it going to be at the heart of the community? And interesting that we found 39% said it was the shops, their local retail.

[28:00]
Maybe that place where they go to have a coffee with someone was the place they find community. The shopping centre was the top response. Church did get a few, but only 5% of respondents saying the church is the place that they find community. Interesting to see where people gather. and that's fascinating when you look at the numbers of community sort of hubs in the community. There's nearly 2,000 shopping centres across Australia. There's a whole lot more pubs and clubs, nearly 7,000. We're getting close to the 10,000 mark on schools.

[28:33]
I don't know if you would put schools in your top three places you find community. If you're a parent, maybe you would. And once you leave school, it probably drops right down that list though. but we do have nearly 12,000, just over 12,000 churches in Australia. So fascinating to see the number of churches but yet we've seen this over the decades, the shift away from the alignment of the Australian church and the Australian kind of cultural community values. We've seen those separating away. It's quite a fascinating time that you and I live and are able to lead in this

[29:05]
period and I think, commend you for being here and taking the time to think well how do we reach that we are operating in a missional framework because we can see that even though church attendance might be on the decline that doesn't mean it's all negative that means there's an opportunity in front of us I might be a little bit optimistic but I believe God's at work and sitting on the throne here by his spirit and doing something fantastic in this nation in this time and through great people like yourself and I'm hoping and praying we're going to see that 15% maybe start to rise back up but we can see that when people tick the census box

[29:41]
do they identify with? We can see that it is over the last 10 years. This is the Christian affiliation. Do you tick a Christian or non-religion? 64% back in 2006, dropping down to 52% in the last census. And yet interestingly, the church attendance decline over this last decade. It's sitting pretty stable at the moment, actually. I'm not sure what your experience at a local level is but this is drawing on some of the NCLS data which is fascinating to see. Maybe there's just a

[30:15]
few of those people that might have been ancestral Christians, if you understand what I mean by that. Maybe their parents were Christians and so they would tick that box because mum and dad said always tick that box and but when it comes to their practice and their everyday life I think we're probably seeing a bit of a thinning out of that group that might have just been cultural Christians, not practicing in that, let alone through to the church attending way to look at the sort of stability, I think, even, that there is in some church, and yet at the same time, we've got a growing population to reach. So when it comes to the people who identify with

[30:51]
no religion, in Australia that was 32%, which means that nearly 7 out of 10 have some world view that it is accepting towards religion and spirituality. It's fascinating to kind of put that seven out of ten. The media probably doesn't show that or want that narrative. Quite a vocal and controlling part of what's happening in terms of the narrative. It's interesting if you split the church attending, sorry, the people who are Christian from those who don't identify with

[31:24]
Christianity, 52% who identify with Christianity, but then that 16% who are regular church attenders leaves that 36% where you're kind of scratching your head going, you say this but you do that. How does this correlate? And probably a few pastors scratching their heads thinking, how do I get people to show up more than just the CEOs, the Christmas Easter onlys? We want to see more people more frequently in church, absolutely. And so it really leads us to the question, well, how warm are people to Christianity?

[31:56]
That ticking one box, sure, you probably go, that doesn't get you into heaven, it's not that big of a deal. question using a modified angle scale, if you're familiar with that, to really look at, well, what are people's responses when it comes to warmth towards Christianity? Where are they out on this scale of responsivity to the gospel? So there was, as you might expect, nearly the 52%, it was a little bit less actually, who considered themselves Christian in a survey we did of a thousand Australians. But we then had this neutral, this warm space where people believe in it but don't

[32:29]
personally relate with it? It was interesting their responses here. People who believe in the ethics and the values. So people who are warm towards it. So you've got sort of a 64% there. Nearly two-thirds of Australians in that warm or kind of Christian space. It's quite positive. You've then got this neutral little middle ground. Nearly just 12%. They believe in religious freedoms but don't want to be

[32:59]
the cold which was one in four who have some issues with Christianity down to those who are passionately opposed which was only about five percent in this survey so the full report with the breakdown of this is available at faithandbelief.com.au you can get it at city and field as well if you want to dive in even more on that we had an event with NCLS where they presented some new research and we had Simon Smart from CPX I'm not sure if you've heard of him he's a

[33:29]
thinker and advocate for the gospel in public space and he made this one great comment that I think really sums up the attitude towards Christianity in Australia. He said this, he said, there's a thin film of antagonism on a sea of apathy. Which I think is just sad in Australia that people just don't give much thought to these big questions. Whether that's from any number of factors, I don't know, but we did do some research

[33:59]
company looking at how do we engage the younger generations in super and you might be thinking what's this got to do with apathy well in this research about the young generations it was looking at well why don't you start preparing for the future quite similar metaphors if you can follow me there and it was one gen zed who said this so eloquently they said it's not that we don't care on purpose it's just that we don't care i don't know if you've had those conversations with young people about faith and their glazed look.

[34:30]
How do we get this message through? So when it comes to Jesus himself, what do people think? What's their attitude and, I guess, response to Jesus Christ? In terms of, we ask the question, was Jesus' life important to the history and culture of the world? Pretty meta kind of question. Interesting to see one in two saying extremely very important. historical, it's still 14% who are saying, no, not that important. It's okay, everyone's got

[35:04]
their opinion. When you personalise this question though, is Jesus important to you personally? The extremely various drops from 53, 22% down to 31%. So there's this cultural acceptance, yes, he was maybe a good guy or even one person in some of the research we did with some non-Christians, It was really amazing. I have 10 people sitting around a research table, a boardroom at McRindle, and we're asking the questions, what do people think about Jesus? Two people who we'd recruited who weren't Christians. It was the most interesting 90 minutes, I tell you.

[35:36]
One baby boomer saying, yeah, Jesus Christ was a great man. We cannot deny that. It's that evidence, historical Jesus is real, had a positive contribution. We had another Gen Xer. We ran a group with just the Gen Xers, and another person said, he's an all-round awesome guy, selfless, caring, sacrificing, all good to all people. Fascinating to hear the responses. The Gen Y response, again, quite positive. This wasn't

[36:07]
actually a negative experience for many people when they talked about Jesus. There's nothing negative about him. He was a very moral person, so many good traits. Interesting their response to the person, to Jesus. So in the survey we thought, well how do you actually attract people who might have a good perspective or thought or attitude towards Jesus? What does it mean to actually bring someone along that journey? How do we lead people to Christ? What actually has an influence on people? And we asked, and one of the attractors that really was top of the list

[36:38]
in terms of what actually attracts people was that it's seeing people who live out a genuine faith. this percentage 16% I think is the most important thing out of this whole project if I can emphasize one part to you today I want you to hear this that it's people living a genuine faith that is actually impacting people and and it's no surprise when you understand the power of a testimony someone who's been set free whether it's from an addiction or found purpose when they were living in a hopeless despairing state that transformation of an individual who can tell that story in a personal real relatable way

[37:14]
argue with, hard to deny. So that impact, and what's interesting is not just having an impact, it's attractive, telling that story. Then second was experiencing a personal trauma or life event. Actually, it's attracting people to religion and spirituality. It's prompting them out of that apathy, or maybe even waking them, rousing them out of that apathy. I was a young boy, seven years old on February the 7th in 1992, walking home from school, holding my sister's

[37:45]
hand, who was holding my mother's hand. And as I walked down the footpath on a rainy day, I was on the footpath, I'll just reiterate, doing the right thing for a change, a car ran me over. Now they'd accidentally left the steering lock which connected to the brake, it was a horrible design, I don't think they exist anymore. And so as a young guy, I got dragged under the car for about 40 metres. My mum and sister running down the street behind me, scene. I'm so thankful the hand of God was there that I think 12 ambulances were rung at a lady who

[38:16]
happened to be at the bottom of the street as I tumbled out the bottom. She lay there holding my head, which was still connected so it was okay, but she was holding my head as I lay on the ground looking up, thinking, is this the end? Am I about to die? For me it was one of those, and continues to be a defining moment. I well up most times I tell the story. So a personal trauma, I share it, it's traumatic, I'm okay. The miracle I think was that when we got to the hospital and mum went home to be with the other two siblings and dad was with me and I think I had over a hundred x-rays

[38:52]
because I was convinced there must be a broken bone. How could a young, I was a pretty small guy then, I'm still a pretty small guy now, but I was even smaller back then, how could he survive being hit by a car and not have a broken bone? How could be dragged 40 metres down the street under the car and tumble out? Now I did have a bunch of stitches it was a bleeding mess and they did over 100 x-rays and couldn't find a single broken bone. Three days later I was out of hospital took two weeks off school to play with all the new Lego I got

[39:23]
and the super soakers I was shooting the doctors and the nurses with so how do we connect with people in those moments of tragedy, trauma, when they're possibly thinking about a real big question that might be in front of them. I hope that's okay to share a personal story. You guys all right? The third one is the stories and testimonies from people who have changed due to faith.

[39:55]
I think it doesn't have to be always your story you tell, but telling the stories when you're casting vision, when you're explaining who we're reaching or how we've built the team of the volunteers, the people you're taking with you. Telling those stories is going to have such a great impact on non-believers, let alone the believers as well. We might just see if you've got any questions there. We'll jump into a bit more of the demographics in a moment but I just want to pause there. So I guess how do we make sense of some of those national trends?

[40:29]
Any comments, questions you want to ask? We've talked some of the demographics, some of the technology, some of even the faith and belief findings as well. Let's come up here for a couple of questions. So if I heard this right, you mentioned you surveyed 1,000 people. Not particularly statistically orientated, but is that a big enough sample size to be confident? Yeah, it's a good question. I work in this role, helping people understand this. It's a great question. Thanks for asking it.

[41:00]
When you're surveying a group of people, you want to find the amount of people that will give you confidence in the data so that it's a representative sample. Now, for the population of 25.4 million, when we look at doing surveys, you actually can get a 5% confidence interval level accurate, so it might change by 5%, and you only need a sample of 385 people, which just

[41:31]
sounds too little. And I can send the link around to this sample size calculator. So whenever we do something for the media, we bump it up to 1,000 so that it sounds more credible, but it's actually credible back down here. The beauty of having 1,000, though, is then we can say, well, what do New South Wales people think different to Victorians? We've kind of got closer to those larger numbers as well, and generationally we can sort of cut the data. So it's a good question and happy to share that link if you kind of want to see, well, if I'm surveying the people in my area, how many do I need to have that quality, robust data?

[42:03]
So good question. Another one as well. Thanks. I come back into the country and I think about how much immigration has happened. It's enormous compared to other countries that I've been in. Is it possible that we have a label problem, that we say we're Anglican Baptist, that means nothing. Even like my church is an Anglican church, we should be calling them international churches.

[42:33]
I just think of how much immigration has shaped Australia post-war. Can we go for a different ticket? Yes, it's good. I think the name of the church is important. I think the DNA of the church and the substance is also important. the marketer in me wants to say yeah the name is it does matter and also the experience of people I think there is unfortunately from any number of parts of Australia's history some negative stuff that's happened in the name of the church that probably is a factor in terms of the cultural

[43:05]
diversity and the ramping up of immigration has been fascinating from a from a numbers perspective in the 2000s I think we're up to 270,000 people for the 10-year average on an annual year we're overseas into Australia. So it's coming back just a fraction at the moment. I think probably there's a little bit of reservation around the experience of people living in our cap cities and that's not directed at the immigrants,

[43:35]
it's just at the size of the cities growing faster than expected. Australia was forecast to hit the population 2050… Sorry, sorry, let me say that again. Australia was forecast to hit the million milestone of 25 million heading out into the 2050s. Now we've come in nearly 30 years early on that projection, which was done back in 1998. So we're sort of three decades ahead of where the growth was forecast, which is where there's a little bit of like,

[44:06]
well, maybe some breaks, maybe some breaks. It's a growth good from an economic perspective, but let's keep going. In relation to how the community's, the warmth to Christianity, Are you working on or have you thought about life before and after the Israel Folau thing? Have you done any work on it? Great question. It's one of those things that's happening at the moment. I haven't got any new stats around that religious freedom, because even one of those options in the scale had a, yeah, I'm up for religious freedom.

[44:38]
I think that's important. Don't have a religious perspective myself. So it'd be interesting to run these again. I'm hoping we can do this survey again next year. We'd love to do it sooner if people have got some resource they want to put behind it. it's practically, this is one of the defining things at the moment that's shaping perspectives towards Christianity. Just after this survey, I'm just trying to make sure the timeline is right, and forgive me if I get it wrong, but we did have the same-sex marriage debate just after this survey was conducted as well. So there's probably a few other key moments in Australia's sort of

[45:12]
national psyche that have really affected probably how we think about Christianity. So It would be great to run it again. I agree. I think there will be some changes. Maybe one last question and we'll keep moving forwards. Just a quick comment on these stats. I remember seeing them when they came out, the survey. We run an evangelistic series, six weeks, call it Life. And we combined two weeks, so it became a five-week thing. But the sixth week was then getting people up, telling their stories. Yeah, great. People who had been sitting in the seats that these people were.

[45:42]
Seen a really, really good impact. They hear the content of the gospel, but to then hear lives change, stories, it's been a really powerful thing. So thank you. It seems like such an obvious thing. It's beautiful to have the data to say this is why this actually hits people in the heart. It's why I'm telling a story when, forgive me, I don't recall the Bible verse off the top of my head, but with the living epistles, people might not read the Bible, but they'll read our lives. And will we share that I used to actually be like this,

[46:12]
but now through the grace of God, I can stand like this. powerful story so thanks for the couple of comments questions that's very helpful so you're ready to dive in a little bit more into some of the technical let's spend a bit of time just getting some practical things in front of you in this last part of this workshop I want to give you some action steps and some to-dos and happy if you do them literally as I speak if you want to flip the laptop out if you're on the internet and you can do some of this on your smartphone as well as we go forwards but the first thing is really in terms of understanding your area just thinking about

[46:46]
this framework when we're chatting with whether it's church planters or church consultants how the how do they guide people to understand their community in that first one it's really about looking to see the people using demographics to see and understand that community so the the three parts that we're going to cover in this little spot is to really define your local community and then to analyze who's in that community and then understand what are the other resources that out there to really inform your picture of that community. We want to help you get a clearer picture

[47:19]
of who lives in your community. When it comes to defining the community, there's, I think, probably some misconceptions that everyone's the same in every community. That's so not true. And when you look at a community, you might see, oh, there's all these different types of people. Only one colour doesn't do it justice, probably. But what's interesting when you're defining your community is it actually gives you some parameters to say, this is the group of people we want to talk about might be a geographic parameter and in terms of defining your area the first activity is what would you call your mission field and you might want to think about that you might already

[47:53]
know great give yourself a pat on the back and tick this one off but that first question is how would you define your local community your mission field do you talk about regions or suburbs or a city, might be a phrase or a cultural group, there's any number of ways. In terms of a demographer, if I have something to do with this, which I do, I've built this kind of tool really saying let's use what we can, particularly what the ABS uses, to really define our communities. So in terms of

[48:26]
the Australian Bureau of Statistics, some of the ways you can get the data is in these, whether it's suburbs, local government areas, you can grab postcode data, whether it's councils or your local areas, those electorates, they're all in there and states as well, you can kind of go quite big. In terms of when you're picking an area, it's probably helpful just to know what's out there that in terms of the way the Australian Statistical Geography Standard, ASGS, lines things up, you

[48:57]
start big at the state level, dropping down SA4, statistical area 4, and then down to an SA3, 2, 1, down to a mesh box, which is probably just a couple of houses on one street. You can't find out what your neighbours earn, it doesn't get that detailed, but it's interesting to see, well, you can get to know a little bit about your street even, and I've found this really interesting, what does it look like at my local little area? A little bit creepy maybe, but I think it's helpful. Now, what's useful, though, is to say, well, when you mention things like suburbs or postcodes,

[49:30]
is that the same as an SA2? Unfortunately, in the ABS, they don't correlate. Now, why would you use an SA2, then? Well, the SA2 is what the ABS have sort of defined, and they don't change over time. So these are consistent, particularly over the last 10 years, whereas things like postcodes, they can move around by the ABS. Local council areas, I'm not sure if you're aware of the last couple of years, there's been so many changes to our local councils that if you were to check the 2016 data

[50:05]
to the 2011 data, you're talking about different areas. Gee, the population's going crazy. No, the boundaries have just been redrawn. So it's important to use something that's going to be reliable over time, which is where I would suggest using that left-hand column is going to be useful. In terms of picking one of these areas, how would you do that? You can head on to the ABS website. There's a geography search function that you can look at and it will give you a bit of an idea of some of the options. I think this is a crucial thing in your journey

[50:36]
to understanding the people in your community from the demographics is to pick one of these ASGS areas to dive into, which really then lets you get to the second part, that community. One of the beautiful things on the ABS websites, it might be only one of the few things that's beautiful on it, but is this part called quick stats, which is exactly what it sounds like. It's quick access to the stats for an area. So for example, you might pick a Parramatta

[51:07]
SA3, which is not the local government area of Parramatta, it's not the suburb of Parramatta, which are both in there. They'll have very different figures. And the SA3 is different again. It's a sort of larger region around, if you know, the Parramatta area, it sort of goes up nearly to Carlingford, heading down Greystains. It's quite a large area, which I think is good because I don't think in my role at Rouse Hill, we're not just trying to reach Rouse Hill's suburb.

[51:37]
We've now got the Metro, which connects us to Cherrybrook, connects us to Schofields. people come from Richmond, we have people, so we're more than just the driving distance these days, there is other transport and ways that people connect to us as well. So more than just the walkable measure, which probably what 50, 100 years ago people used to say, well, what's our area? Parish, whatever language might be. We think maybe there's a little bit larger areas that people could be using. So it's a way to really jump in through QuickStats and QuickStats breaks things

[52:08]
down by three key things. You can look at the individuals, the people. You can look at families, as well as who's in a household. Sometimes they can blend over, as you can imagine. So just to give you a bit of confidence that you might be going away from here today thinking, it sounds interesting, but what would I be looking at if I looked at the ABS website? I've got a few screen grabs here just to give you an idea.

[52:38]
page and you hit the census button, the second one along, and then you hit the quick stats option, you type in, I'll just use where our office is, which is in Borkham Hills, Bella Vista. There's 20,000 people that live in this SA2. Now an SA2 is sort of like a suburb, but it's not exactly the same, I'll just reiterate that. That's a pretty handy first page, just to talk you through, it's got the number of people, male-female splits, the median age. Now you might be thinking 38,

[53:09]
is that good or bad? And it's not good or bad, but it's more just what does that mean? Nationally, the median age is 38. What becomes interesting is as you start to look at areas, you think, I wonder what Brisbane's is, I wonder what Tasmania's is, I wonder what Port Macquarie, the retirement capital of the median age, what does it do? This is what you're able to see. Somewhere like Parramatta, median age in the SA3, I think, is down to 32. So you can see a younger composition in that area.

[53:41]
The number of families, I find this one's a great one for prayer meetings. We're going to pray for every family, all 5,000, not by name, but a great way to pray for your community. Be specific, lifting to the Lord those in your area. The number of children in families, even the number of dwellings, like what's the median rent in your area? Number of vehicles per dwelling. This is part of the hills. It's at 2.2, which is actually quite low for the hills. I think it's usually up around the three mark, number of cars per dwelling.

[54:14]
Until we got the train. Let's see what happens at the next census. Have people burnt their cars? I don't know, but we'll see. So I wonder what your area, if you're on your phone, you can literally, ABS website, census, quick stats, type in an area. Just make sure you pick, is it the suburb? at the SA2, SA3, you'll hopefully get a map, and you can start to see some of this right away. Now what I've often done with church planners is said, here's a couple of tips, I'll give you these tips as well, but just go and spend an hour diving into it. A first kind of jump into the ocean of

[54:45]
demographics, and this is the quick stuff. Hopefully we're going to make this helpful for you, because how do you actually make sense of it? It'd be nice if we could give every one of you something like this. This is a little snapshot of the Rouse Hill area where we've just grabbed the QuickStats data and put it into a template at a cost that's about $1,500. We can do that. It still takes a bit of design time but we can get that visual for you. So that might usually be, if it was a fully bespoke project, a fair bit more. We can bring that down, make it pretty practical. Fascinating to see when

[55:22]
you compare to a suburb to a capital like a greater sydney area that gives you a bit more of insight into the trends because a trend is really a movement in the data but it's helpful when you can compare that over time or to a different location so that's what you want to do that's why i want to say look at your street look at your area but then think about where maybe your parents grew up or where your friend's living on the next barbecue you can show up and be like oh do you know the median age in your area interesting you're bucking the trend are you

[55:53]
When you're in the page, if you scroll down, you'll see some of these tables. And inside the table, you'll have the area itself sitting alongside the state average, which, again, begins to give you that insight into the trend against another location, as well as the national average next to it. But in this area, it's fascinating, this is Bella Vista. So if you know the northwest in the hills, the 25 to 29-year-olds is 5.2%, compared to the New South Wales average of 7%.

[56:25]
I wonder why. And that's the journey that you then go on. Well, who can I ask? Oh, let's ask a 25 to 29. Why aren't there people of your age in the area? Maybe you want to ask the parents' generation, why aren't there many 25 to 20? Now, there's still 5.2%. It's still there, but there's just that dip in that area. I wonder what your generational profile looks like in your area. What are the dips, the peaks, the troughs? what generational assets do you have and what are the gaps as well what does that look like when it comes to planning for mission activities

[57:00]
community outreach it's being beginning to become hopefully more specific as you scroll down that page it's a good page quick stats maybe it's not so quick anymore but this is still on the first page you can see ancestry country of birth so in the Bella Vista area, this is exactly where you find your top five. You've got China, India, England, Sri Lanka and Hong Kong. And you can see compared to the, even using the national is fascinating at that one.

[57:31]
This is helpful. I'm moving too fast. I think you guys are doing okay. So let's keep scrolling down. You can then see that religious affiliation. Now in this quick stats, it doesn't group some of the Christian denominations together, but it begins to give you some of the top ones. So you'll see Catholic, no religion, Anglican, Hinduism and Pentecostal. You might know a big church that is in that area. If you know Bella Vista, Hillsong is located in this area.

[58:02]
Then if we keep scrolling, you get down to things like employment. So this is great if you're running some community programs, maybe there's that food bank or other social initiative to help address some of the needs. This might give you some of the stats around the household, the work, family composition, to understand who actually lives in this area. So it's a pretty useful first page, first glance. I'd suggest spend a bit of time yourself looking into it, but then grab someone else from your team and say, hey, this is what I see. What do you see when you look at this data?

[58:33]
And you're beginning to become that trend analyst looking for those changes. Now that's just giving 2016 data. At the top of the page you can toggle and go back to 2011 or 2006 and you begin to see the trends over time but you've got multiple pages, can be a bit complicated. So the beauty is that there's a thing called community profiles and what this does is you type in an area in QuickStats and just underneath the Borkham Hills West Bella Vista there's a line that says search for community profile. I can barely see it from here, I'm sorry if you can't see it but search

[59:06]
for community profile, if you hit that, it will then take you to a page where you can sort of download a time series profile for your area. So again, just following the steps, it's time series profile. I'll give you all these slides so you can follow it. The time series profile is the profile over time for that area using the last three census periods. So you get a beautiful Excel spreadsheet of your own. It's straight from the ABS. So save it and then

[59:36]
create another copy and save it again so that you've got the raw data. Keep that nice and clean because you can then play around with this one, this one that you've created as your own. Now, just a few things to talk you through in terms of this spreadsheet. It can be a little bit daunting to sort of just start going through the tabs at the bottom. You can see them on T01. What's really helpful is just to go to the list of topics down the bottom and it will show you what those census questions are and the responses. Then when you dare to jump into one of them, there's two pages of topics, there's quite a bit of data in this spreadsheet

[1:00:07]
over those 10-year periods. You can see some of the categories there, household or housing costs, education, employment, childcare, cultural language diversity. So it's some good stuff in here. The early one had, so the person, the dwelling and then the family characteristics. So like I mentioned before, when you then jump into it, you can start to see it will group things together. So one page the three census periods in one page.

[1:00:37]
Other ones, though, split it out. On this page, for example, we're on T12A. We're looking at religious affiliation in this area. This is just 2006. So you need to go to T12B to grab the 2011 and T12C to get 2016. You can do all your Excel wizardry, copy and paste, build your own formulas into it. I know a few of you just can't wait to get home tonight and do this. I can tell. I can feel the energy. so as you're jumping into it here's just a couple of questions i don't want to spend too long in

[1:01:08]
that space but i know that some of you will really jump into it and i'm not not joking when some of you will get home tonight be like great i've got a funding application for a program i'm doing i need to show how many young kids in my area i need school breakfasts that's where you grab the data so questions things like what stood out often it can confirm assumptions you might have about an area where you and the leadership group might be saying we think we know this and we've got these kind of inbuilt maybe biases, but here's the data that proves it. It can also be good to see what surprises you.

[1:01:40]
And be open. Be prayerful, be scientific, but be prayerful in your analysis as well. Remember Jesus saying to the disciples, look, look at the fields, see. So in terms of spending some time in the numbers, I think when you've done the community profiles, That's pretty good. I've got a fair bit there to go with. There's still more. If you can stick with me for a little bit longer. There's some additional sources.

[1:02:11]
And the census is all we've been talking about right now. But that's only a part of what the Australian Bureau of Statistics actually collects. So the census is done every five years. But they're doing surveys throughout the year on so many interesting and different topics. If you hit the statistics button on the top left, I like that they've even put statistics first, census second. maybe gives you an indication of how much data they've got, more than just the census. Statistics. You can see some of the categories. Economy, health, labour, industry.

[1:02:45]
This is where you can jump into some… And these are getting updated all the time. At about 11 o'clock on most days of the week, I get an email from the ABS with the new release of data. I can send you the link if you're prepared for your inbox to fill up a little bit. You might just find one or two that are useful through the year. It might be the latest health data on disability, people with disability in their community. It might be more around the housing needs because you might be thinking, okay, I'm running

[1:03:17]
some social housing in our area and we need to keep up to date with the latest stats for national and local. Sometimes I'll even show SA2 data in these surveys. It's fascinating what you can get your hands on. So in terms of what's available, you can find stuff on crime. example. One of the best things to do is sort of head to the summary page on the top left where that green tab is. That's where you want to start. If you can find a media release, even better. It's language you and I can get. Some of the other tables I'll show you can be a little bit

[1:03:52]
more complicated. But in terms of things like the first one was crime, we've got disability surveys, and these category numbers, me and a couple of guys at work are trying to memorise them. We're so great. There's so much data available here. The census is one as well that they do keep updating parts of it as they keep analysing it. It takes about 12 to 18 months to get that first major access to results from the census, just because of how big it is. So you can imagine that even though it's done every five years, even through the five-year period in between, they're still

[1:04:25]
updating, releasing more micro parts of it. So you just want to check that you're using the as well, which is why I've highlighted this one. I had this happen on YouTube the other night. I thought I was watching cricket highlights of Australia. I think it was beating England, but it was from the previous World Cup. Faulkner did amazing. I went into work the next morning, I was like, guys, did you see it? He hit 30 off the last three overs. And they're like, Australia versus England? It hasn't happened. It might have happened by now, but I was out of touch.

[1:04:58]
I was reading the wrong release. No, it was YouTube, not ABS, but I think you can understand the translation. You want to make sure you've got the latest data that you're accessing when you're downloading it, starting to analyse it. In terms of some of the technicals, it's got an explanatory notes section. It gives you some of what they mean when they say homelessness. Does that mean someone who's occasion? It gives you that level of depth if you want to jump into it. And it's also got the data for download. So you can grab the Excel files. Some of them have a little PDF summary,

[1:05:28]
but most of it is Excel tables, so be prepared. There's one other part that's really helpful, I think, as well, on the homepage of the ABS. If you scroll down to the very bottom, they've got a data by region button you can click, and that just gives you all that they've got for a location, which is pretty useful. So you could put in an area, and then you'll begin to see what's actually available. It gives you a few quick summary stats of the area, but then on this sort of page, it begins to show you,

[1:05:58]
you what data is available from what source over time. So for your region this could be a helpful one to to plug in and jump into. There's a fair bit you can at the bottom it's just got the little download link that's why I've got that slide there. Well you guys have done very well let me just check if I've missed anything in these last couple of slides. When you download it again you probably just want to check through these contents pages making sure you know exactly where you're up

[1:06:28]
to dive into. In terms of some questions when you're looking at your area, think trends over time. That's what's most interesting, whether it's migration, whether it's homelessness, crime, finding out what are those trends that are changing over time. That first hour is really just a first glance. There's a lot of potential data. Now you might have some assumptions, you think crime's going up in your area, you're hearing it, you're seeing it, yes, it's all happening, but now can you jump in and find a source that can prove it? This is hopefully can find that. A few questions, I'll share those with you in the slides. In terms of the next steps,

[1:07:05]
once you've done some analysis, what we want to encourage you to do is try and simplify the trends down to what do you think are the top 10 trends impacting your community? That's quite subjective, I can appreciate, but what a great place to start. Your opinion, using the data to tell a story about your area. A great activity for your team even to say, well, hey in a month's time we're going to do a brainstorming session pulling together all our analysis what do we think of the top 10 trends shaping terrible what are the top 10

[1:07:36]
trends shaping brisbane and and whether the region is a large region or a small region those trends you might be informed by some of the national trends but i also think be prepared to just be specific into your area looking for those generational trends there might be trends you think more than just demographic trends as well. You might see from the data that there's a higher proportion of people identifying with no religion. So put that in there. It's in the census, but then you might be able to give

[1:08:07]
some more colour and flavour to it, and it's because of this or the trend is that. So be prepared to give it a little bit more life. I think once you've got those top ten trends, what we're really, I guess, wanting to do is ask you, what's the most effective way to lead that community to Christ? In response to those trends, if there's fewer cars in an area, people are more active. I'm picturing any of the metro train line related areas in the northwest, which will then go southwest. There'll be a Sydney to Parramatta one over the next decade too.

[1:08:38]
What will happen as Sydney becomes less car dependent? Maybe only slightly, but how will that change the way we do mission? How will that change the way we're reaching people? Just one example. I encourage you to brainstorm some responses to those trends. How will you and your team plan and develop strategies to reach people? If I could give you just a couple of tips to maybe give some priorities or some ranking to those ideas, I'd suggest these couple of things, which is what we've put in the 5Ls tool.

[1:09:08]
Think about what's actually having a current impact at the moment. Out of all those trends, which is actually impacting people now? Some trends might be more future-oriented and therefore something to plan for. some things might be right here, right now. There's an opportunity, there's people moving into the area, what could we do? Who are they? How do we connect with them? So the time and impact is one way of assessing those ideas you've got as you develop strategies to respond to the trends. The other is to look at, well, when you think about the activities you're planning,

[1:09:40]
think about how much is this an activity that we could share the gospel through? Cultural diversity might mean there might be a language barrier, So do we have a plan for that or is that blocking that activity being effective in sharing the gospel? You might want to think about the resources you've got, how prepared you are. Is this actually achievable? You might come up with a grand plan, but you need to get partners on board, sponsors on board. So take the time to assess those ideas that you've got.

[1:10:11]
Often as a pastor, I think my first idea is the best idea because it was from God, because it was the first one. but a bit of prayerful consideration, some chatting with peers might lead to just three final parts here to sort of begin to land is to say it could be some more innovation if we chat with people. If we do this discussion with a team or with a friend or an expert in sort of church planning, there might be other ideas and that collaboration is really important. The wisdom of the people of God because we really want to help you become responsive. This is what we're all about. We want to see you engaging thoughtfully, but also pragmatically, looking into the data to find who is in that area, seeing those people, so that you can respond with initiatives that really hit the mark.

[1:10:56]
And in a way, you'll have the data to prove that they're the right idea. Now, does it mean it's effective? I'm not presuming to be able to answer that, but I hope this has been helpful to give you a bit more confidence, because it can be pretty complex when you think about a suburb or an area going, we'll hopefully just list those 10 trends and then come up with some response options to each one of those trends and then take the time to assess those response options and go, is this actually something we can do? Is this going to be a good means

[1:11:26]
in terms of gospel openness? Will we get the gospel conversation through this? Not every idea needs to be acted on. Take that pressure off yourself. Hopefully thinking a bit critically about our approach A bit of pruning, a bit of less is more, so that you can really multiply the effect you're having. If you want more information, I want to encourage you to head to Faith and Belief, which is available at cityandfield.com. I'd love you to subscribe there.

[1:11:57]
It'll mean a way of keeping in touch. We're doing some new research at the moment that will be about Christian giving. I'm not sure if you're thinking about mission. It often does involve finance. That's one of the things. So this will be a new report we have available over time on there, And a great way if you wanted to get in touch, if you wanted to explore doing some infographics as well. I do want to just give some time. I've got a little bit of time left, which is great for conversations because hopefully you're kind of like, where do I go now? What's the next step? Hopefully I've given you a few ideas and a few activities, but happy for some questions if you have any more.

[1:12:29]
I'll pop my details up there. It's just got info at McRindle. My name's Jeff, G-E-O-F-F. At McRindle is my email if you want to send something straight through. But happy for some questions if people want to jump in. sort of a comment on the abs census do you think um having like not having an option christian like is is kind of skewing the data at all like i remember you know i was thinking oh okay i'm

[1:13:03]
christian evangelical what box do i tick oh there's no box i'll put i'll write a new box like But do you think, given the fact that denominations are kind of changing, etc., do you think that skews the data? And if so, do you think there's any chance that they will review it? Or is that, I don't know. Yeah, it wasn't a surprise in a way that even though 52% ended up saying Christian, no religion was at the top. It was a funny skewing even of how the response option was laid out. I don't know too many people that work at the ABS,

[1:13:35]
but they're good people doing their best in their role. But I think there is also just thousands of denominational options, which they do have, if you prepare to dive in, they've got four categories of those in terms of four levels of depth. The first option shows probably about a dozen. Then there's the breakdown of the K-Catholic or any number of Orthodox. There's just so many variations. So probably it's not their fault. It's probably all I'm trying to say,

[1:14:05]
that they're trying to do their best to categorise and show the larger ones but I also think there is just a little bit of opposition in that space as well to simplifying it. I think even in SRE, if you're familiar with the SRE narrative at the moment, they're trying to help little kids and parents make the tick box options a little bit easier so that you can pick Christian SRE, that's just what you want, not that you have to pick this version or, so they're trying to help

[1:14:35]
if we'll get it through ABS. They are open for feedback, though, so please, if you want to put numbers behind it, we can put suggestions to them. They are always open for feedback, so it's great to hear from them. Good question. Thank you. Yes? This is with regards to the previous data that you had with people being warm, neutral and cool. Were you able to drill down and see whether there were ethnic kind of… data that showed that people from Anglo-Saxon backgrounds

[1:15:09]
were more the call towards Christianity and all that kind of thing? That's a great question. And this is where the survey of 1,000 allows us to see what do Australians think. We wouldn't have enough, I don't imagine, to say Anglos, Asian, African. The survey might be bigger to get that sort of perspective. I can have a look in the report and happy to talk offline about what we can say on that area because it's a great question and I think probably one of the helping factors is some of Australia's church decline has been helped because of a multicultural approach to church that we are seeing growth

[1:15:43]
in some of the culturally diverse churches. So it's an interesting question. Sorry, I don't have a quick answer. Any other questions? Just a quick comment before my, is that okay? Quick comment before my question. to the previous comment about whether denominational labels are helpful. Something we found or I found with a few local churches is that in terms of Caucasian Australians,

[1:16:16]
denominational titles were a repellent, but for some people from Asia, it was actually a plus. It was a plus because they knew the denomination title knocking with a few local communities when you say you're anglican it means not a cult so that's actually helpful as well my question actually is about the strong attractors to faith i wanted to ask what how was the question posed yeah if you remember at all yeah it's in the

[1:16:46]
report i haven't got it memorized but it's it's really around what attracts it's as simple as we try to write it we try to make our surveys more conversational than uh to technically uh and accurately respond. So happy to share the question with you. It's in the report exactly as it was worded. So it's there to see. I just haven't got it memorised. All right, maybe time for one or two more questions. Got one of the best social researchers in Australia, people. Let's ask him some questions, hey?

[1:17:21]
There's a couple. I love the faith report that you guys put out and I've looked through all of that at an Australia-wide level but I'm in Canberra which I suspect is quite different to a lot of the rest of the country and I'm just wondering is there any way that I can get that sort of quantitative data, I mean aside from paying you guys a lot of money obviously, how can I put that together

[1:17:52]
anecdotally. Yeah, there's a great movement called Movement Day that's existed for a couple of years. I think birth from Tim Keller and I think there's a fair momentum that's building around that. Movement Day are really trying to explore how do we help cities tell their story and even within cities, the little regions within cities, so that you can find the narrative for that area, find the pains, find the hurts, understand the challenges and then hopefully track over time the power of

[1:18:23]
unity in an area. What city transformation, that's their heart and their approach. I think in terms of capturing data, the census, if you pop it to just ACT, Canberra, it will give you this sort of overarching narrative of the location. That's really only that religious affiliation question around spirituality they've put in there. So I think it's then starting to think a bit more critically and going, okay, well, how could we run,

[1:18:55]
like we ran focus groups with, we used generations, so we did a Gen Y, Gen X and a baby boomer group with people who didn't identify as Christian to understand what do you think when we talk about church or when we talk about Jesus or what's been your experience or did you grow up in a Christian family? So just to understand the narrative and what would be interesting in a location like Canberra public sector's got its home base there and how does that influence when it's a very uh it's one of the leading uh places of wealth in in the nation how does affluence impact christian

[1:19:29]
influence and and so really trying to be smart in how you approach a research project in an area like that going what would be the interesting things to understand and delve into so you you've probably got some assumptions or questions if you remember year eight science you'd call them a hypothesis, it's good to write those down. What's your primary research question? What would you love to find out about Canberra residents? Now, a survey like the one we did in Faith and Belief was about 15 minutes long. You might only have three questions. And so you can do quite short,

[1:19:59]
kind of taking the pulse types of projects. I don't have to be grand with infographics and all the nice extra stuff, while we think it's important. But you can do smaller scale stuff is all I'm trying to say as well. And potentially even do it. Technology is pretty amazing. You can do your own surveys in the five L's. We teach people, well, jump onto SurveyMonkey, get onto one of the free platforms. You can use things like Slido is one of the great tools. So at an event, you could pop a question up and get 100 people responding with three clicks,

[1:20:31]
capturing your own data. What's the biggest challenge of living in Canberra? And you could do that online through Facebook ads or your own Facebook account. There's different ways you can collect data. It doesn't have to cost money. And this is the democratisation of information, you are in control. So if you want to find something, I encourage you, there is probably a way to get it. Happy to chat, empowering you guys and that's really what I'm here to do today, just to say it's not a funnel come to MacRindle, we're here, this city in field thing is to say what could we do from our experience to empower you, to release you

[1:21:03]
and encourage you to get out there and start doing it. So happy to chat because it's sometimes a little bit daunting but always happy to chat. I think we had another question, thank Thank you. Second question. Good. Multi-ethnic. I'm going to go specific. I'm around near a region called the University of New South Wales, Kensington-Ranwick. There's lots of students there, but they're staying around. They're getting permanent visas. What is their affiliation with religion?

[1:21:33]
How do they feel it? I'm just… It's amazing you can talk about things. Nobody else is talking. I want to ask you about multi-ethnic eastern suburbs. Yeah, fantastic. Universities are interesting. We've had a few people asking us, are international students part of the census? And we're trying to just get that crystal clear because we want to make sure that if we're talking about… I was chatting about Macquarie Uni the other day and I wasn't 100% sure, to be honest, if the international students were in that. So when it comes to an area like that where you've got people who then become permanent residents,

[1:22:05]
they'll be then integrated into completing those results. something I think if you jump onto some of those quick stats pages you'll see I expect things like that higher no religion affiliation, you'll see higher education being around a university challenges though are probably increased rent, living costs cultural diversity probably far higher than that 29% national average. If you jump into areas like right in that urban core you'd be surprised how high that can go in some areas. I think Rhodes has it

[1:22:40]
88% mark, which is astonishing. So that's not even proper inner west. That's sort of on the river still. So that inner city area is a fascinating, pretty challenging space, but also this is where the gospel needs to be shared. So great to hear you're in there. I hope that's helpful. It's not too much detail, sorry, but hopefully a few tips there. All right. Well, thanks so much, Geoff. Everyone, please give them a round of applause. Thank you.

Contributors

Geoff Brailey
Geoff Brailey is a researcher associated with McCrindle Research. He contributes to Reach Australia’s training on using demographic information to understand local communities.

Your support helps keep these resources free for all to access.

With your financial support, we can help keep these resources free and available for ministry leaders across the world. We don't want anything to get in the way of equipping and resourcing church leaders - so we offer these resources from our network free of charge. Yet, we can't do that without your ongoing support. Please consider giving financially to help keep these resources available for gospel workers across the globe.

Partner with us

Want Reach Australia updates straight to your inbox?