


Tom works as the Ministry and 6pm pastor at Christ Church St Ives in Sydney’s north.
I had my first child earlier this year. It’s been a sleepless experience of joy, tears, worry and more joy. So many feelings! But can I tell you something that has struck me about the whole thing? I’ve been surprised to find that, at every step of the journey, people are always talking about data. How much does she weigh? How long is she? How long should she nap? Data. Data. Data. Before we were discharged from hospital after the birth the paediatrician came in to check that her measurements were all acceptable. At the vaccinations the nurses always weigh her.
At the early in-house visits, the nurses wanted to monitor her bilirubin levels. I had no idea what a bilirubin was, but once I realised that the results of that measurement either forced us back into hospital or allowed us to stay home, it’s safe to say I was VERY invested in that number. I don’t inherently care about bilirubins, but I do deeply care about my daughter, and bilirubin levels affect my daughter’s health, so now I am all about bilirubin levels.
I once heard it said that we measure what we love. I love my daughter and so I want as much data about her as I can get. I also love God’s church, and so I want as much data about it as I can get.
Few of us were driven into gospel-work by a love of data.
We signed up for maturing believers and reaching the lost. But how do we know if that’s happening? Ultimately, there are two main ways:
- Stories/anecdotes/case-studies, and
- Data.
For my daughter, I could tell you a story (she seems healthy because she smiled earlier this morning). I could also give you data (she seems healthy because she’s in the 80th percentile for weight). At our church (Christ Church St Ives, in the northern suburbs of Sydney), we have no problem with stories. But this year we’ve also tried to turn up the heat on the data. So let me tell you four stories about data:
1. Data corrected our perception
When you walk into the 6 pm service at our church, you’d be forgiven for thinking that it’s just for young people. It’s common to chat with someone 28, 35 or 50 years old who says that they feel ‘a bit on the old side’. The perception is that almost everyone is at uni or even high school. Practically, this perception can create a problem – that people turn 25 and start thinking about moving to a different church. So we ran the numbers…
On 3 September 2023, 35% of people who checked-in to the evening service were 25 or older. Even more surprisingly, 20% were over 30 years old. When we share this with people at the evening service, the response is usually ‘oh really?’ A few people have actually been so surprised that they questioned whether the data was accurate. Often, it’s helpful to accompany that data by pointing out a few baby-faced people in the room who look like they could be in university, but have actually been graduated and working for three years. The data allows us to love people, by helping them see that there really is a viable community here for them. It’s possible that using data like this will actually help some people invest more deeply into this congregation, rather than socially disconnecting.
So here’s a question to ponder: How could data help you change the perceptions of people at your church?

2. Data empowered Lachie
Meet Lachie. Lachie became a Christian about five years ago at our church. Having matured in his faith since then, Lachie has taken on the role of fostering a loving, one-anothering community at one of the three Sunday services. He does this in his free time, alongside working full time.
At the start of this year, we wanted to push Lachie forward in his leadership. So we asked him what he wanted to measure. Rather than telling him what to measure, we sat with him and considered it together. This naturally led to lots of theological discussion, which sharpened this thinking and increased his passion for the role. Eventually, he came up with four data points that he wanted to measure month-to-month:
- the number of members at that service,
- the number of people who had attended at least once that month,
- the number who attended the monthly post-church meal, and
- the number of people attending our ‘membership moment’ (belonging course).
You might have your own opinion on what’s worth measuring about community at church, but what matters here is that Lachie was able to choose his own metrics. As a result, he’s more focussed. When we meet to discuss his role we can together analyse trends in the data, which usually leads to clarity on what needs to be done next. Would it have been quicker for a staff member to simply assign Lachie some metrics? Sure. Would it have excited him and increased his keenness to serve? I doubt it.
So here’s a question to ponder: do the volunteer leaders in your church measure the outcome of their labour?

3. Data showed us a clear problem
We’ve really benefited from Reach Australia’s framework for ministry, which looks at discipleship through five lenses: deep in the word, godward attentiveness, on mission, in community, serving others. Focussing on that fifth lens (serving others), we thought it would be a good idea to count how many people at church were actively doing that. Specifically, we started measuring the proportion of church members engaged in a formal church serving team. Let me clarify: that doesn’t mean we don’t value informal or sporadic service and we know that not everyone’s life circumstances allow for serving in this way. But we thought it was a decent first attempt at measuring something to do with the ‘serving others’ outcome.
We found that, at two of our services, about two-thirds of our members were actively in a formal church team. Not bad. But we also found that, at the third service, only one-third were. Not good. That’s a big divergence from the servant-hearted community pictured by the New Testament. That’s a long way from every member of the body playing its part.
Is that depressing? A little. Does it give clarity? 100%. At least now we know where the biggest problem is. Although we will keep fostering a serving culture at the other two services, the data helps us see that the clearest next step is to galvanise the 9:15 am group into serving.
So here’s an exercise to try: count the proportion of people at each service who are engaged in a formal serving team. St Thomas’ Anglican Church, North Sydney have been doing this too.

4. Data showed us the future
Data also helped us foresee future trends. Reach Australia often uses the language of ‘ecosystem’ to express the interconnected realities of church life. Just like most suburban churches, the kids, youth and young adults ministries at our church are all deeply intertwined. For example, the majority of kids leaders are youth and young adults. The majority of youth leaders are young adults. When the kids ministry grows, it inevitably bulks up the younger end of youth group in future years. When youth group grows, it inevitably bulks up the younger end of the young adults ministry in future years. It’s all connected.
So we got the people responsible for these three age groups in the room together and ran the data. How many one year olds do we have at church? How many two year olds? How many three year olds … How many 24 year olds? If you are in a small church, you could perhaps do this by bigger categories: how many 0-5 year olds? How many 6-11 year olds, etc? It’s a similar exercise to this form of government chart you might have seen before.
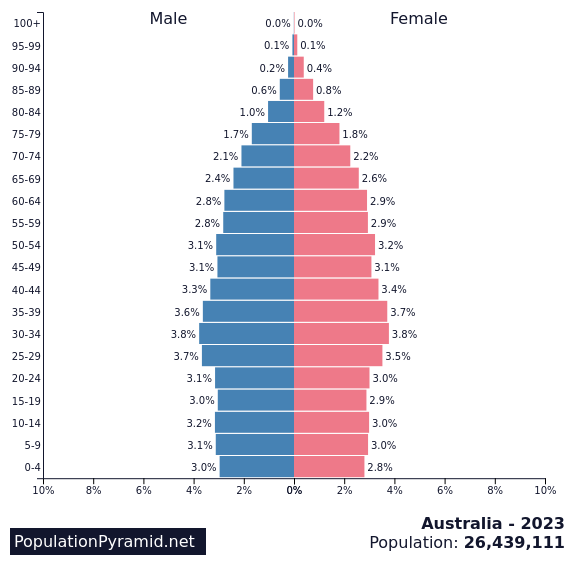
What did the data show? We have a smaller group of ten year olds. On the one hand, that’s fine, because year-by-year variation is normal. On the other hand, if we’re aiming to make mature disciples in ever increasing number, having an obviously smaller cohort isn’t ideal. The smaller group of ten year olds grieves the kids minister right now, because he’s responsible for that age group. But it also worries the youth minister, because that cohort will soon graduate to youth. With clarity on the current situation (now), and knowing that we’d like to increase the size of that cohort (where), we could have a focussed discussion on strategies to achieve that aim (how). One strategy could be, for example, to recruit some of our best-equipped young adults to serve on that specific cohort in the kids ministry.
So here’s an exercise to try: count how many active participants you have in each age group between 0-25 at your church, and come up with a plan to address the smaller age groups.

My Daughter
In case you’re wondering (which I know you’re not), between the start and end of writing this article my daughter weighed in at 7.6kg. Apparently her head circumference is in the 97th percentile for Australian girls. I love my daughter.